Click here to see the tracker live.
There are a lot of reasons I do CrossFit, but two are easy to quantify: (1) I want to get stronger and (2) I want to reach a healthy weight. A couple of years ago, I realized I still hadn’t hit a classic milestone: a bodyweight back squat—loading a barbell at (or above) my current body weight, squatting to full depth, and standing it back up. It’s a fun goal because it combines both targets: getting stronger while losing body weight closes the gap from both sides.
I’m a highly visual person, so I imagined a simple plot over time: body weight trending down, back squat trending up, and the two lines eventually intersecting. Naturally, I built it—but as a data scientist, I didn’t want to stop at a static chart. I decided to:
- Build a data pipeline to pull my body weight, body composition, and squat data from online sources.
- Fit simple models to forecast weight and strength.
- Estimate the date (and weight) when I’ll hit a bodyweight back squat.
- Present everything in interactive visuals.
- Automate data updates and figure generation in the cloud.
Over the last couple of weeks, I’ve been working on this and I’m excited to share it as my first project on this site.
Building the tracker
Step 1: The data pipeline
Withings API for body weight and composition measurements
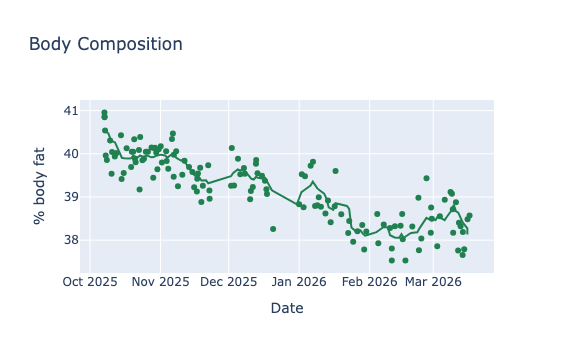
Last fall, I decided to get serious about fat loss while continuing to build strength. Because I cared about fat mass versus lean mass, total body weight alone wasn’t the best measure of progress. Weight also fluctuates day to day with food, hydration, and timing, so I bought a smart scale that estimates body composition (fat, muscle, water, bone). One feature I love is that I can “blind” the display when I step onto the scale, so I’m not reacting emotionally to a single reading. All measurements are stored in the Withings app, and it also syncs with Whoop (including the dreaded “Whoop Age,” which—thankfully—has been trending in the right direction lately).
I settled on the Withings Body Smart Scale because it integrates well with Whoop and has a solid developer API for exporting data. The official docs are excellent, so I won’t rehash them here. If you’re curious about my implementation, my code is in this repository.
Scraping BTWB for workout results
I subscribed to Beyond the Whiteboard (BTWB) soon after I started CrossFit in 2022. It’s built to help athletes make data-informed training decisions, and I’ve logged nearly every workout and lifting set there since then—so it’s a perfect source for this project.
Unfortunately, BTWB doesn’t offer a public API. So instead, I scrape my data using browser automation tools like Selenium, which can log in, navigate the calendar, and extract the workout text for each day. It works well, but it’s inherently brittle: if BTWB changes their site layout, I may need to update the scraper. They’ve made some recent improvements to the site, so I’m hoping it stays stable for a while.
Step 2: Modeling
Linear regression for body weight and composition
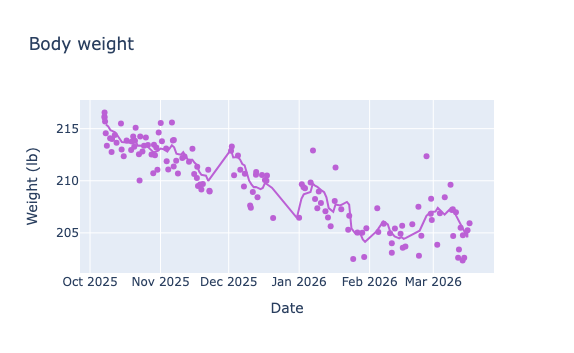
I spent some time thinking about how to model and forecast body weight, but I ultimately went with good old-fashioned linear regression. I weigh myself 5–10 times per week, so there’s plenty of data. Because body weight fluctuates day to day, I first apply a 7-day moving average before fitting. Since the goal is a short-term forecast, I fit only the most recent 90 days to capture the latest trend. Nothing fancy. Implementation-wise, I used LinearRegression from scikit-learn.
Squat strength over time
If you ask someone for their one-rep max, they’ll usually tell you their all-time personal record. But if you hand them a barbell and ask them to max out today, what are the odds they match it? We all know the answer: it depends. Have they been squatting heavy lately? Are they peaking for a test, or do they only max once or twice a year? Maybe they’re a beginner improving so fast that every attempt feels like a PR—those were the days.
Strength is finicky: it takes time to build, and it fades faster than we’d like when training is inconsistent. Age plays a role, too. If you see an octogenarian deadlifting a PR, they probably didn’t start lifting 40 years ago—they likely started more recently and progressed steadily. And sometimes it really does come down to how you feel that day: sleep, stress, and recovery matter. As the saying goes, you don’t get stronger during the workout—you get stronger as you recover afterward.
Now let’s approach this like data scientists. The data here are noisy and sparse—and because I do CrossFit, the sparsity gets worse. My current programming is old-school CrossFit: no linear cycles, one or two heavy days per week, sometimes pure lifting and sometimes mixed with conditioning. It’s also constantly varied. One week we might do 5×2 back squats; the next we might do 4×3 front squats. We may not see a true one-rep-max back squat test for months. So how do we model squat strength in the meantime?
Even though true one-rep-max tests are rare, I do squat every week. Squatting is one of CrossFit’s fundamental movement patterns, and many would argue it’s the most important. So while I’m not maxing out weekly, I am collecting useful submax squat data week to week. Here’s what that data looks like.
Types of squats
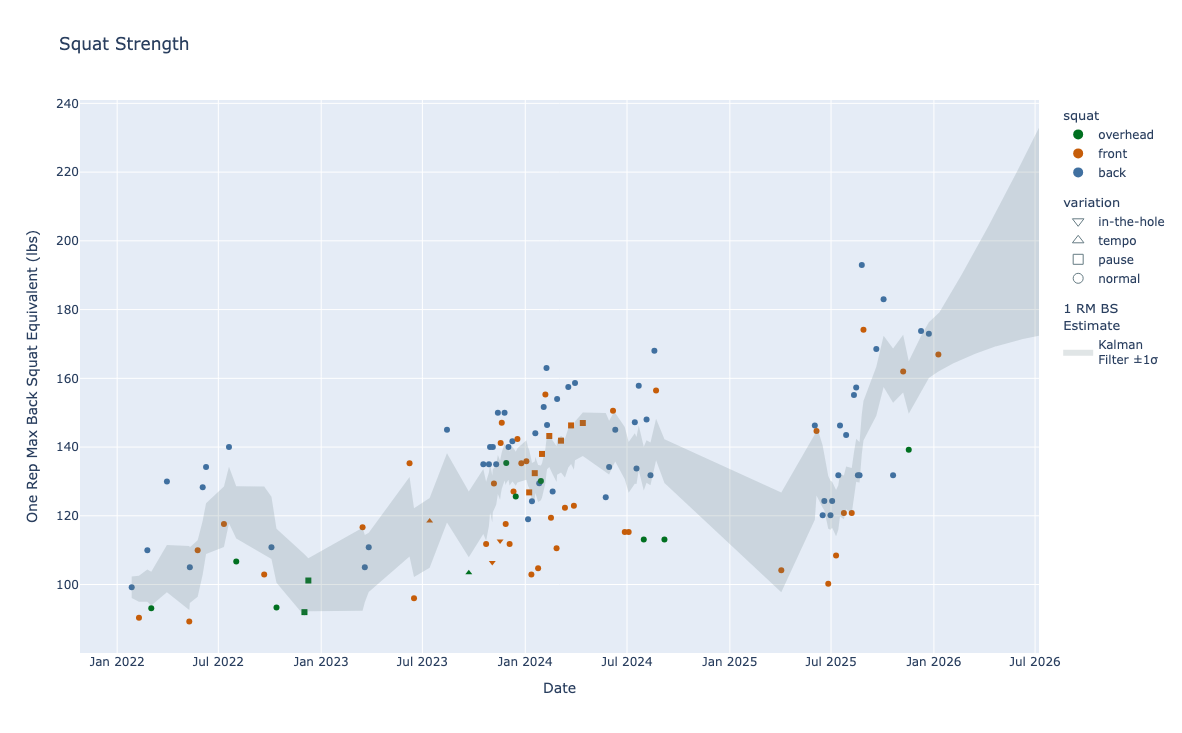
There are many squat variations, with and without a barbell. For simplicity, I’m restricting this analysis to the three barbell squat variations: back squat, front squat, and overhead squat (see the videos below for a demo by James Hobart).
Because of biomechanics, weightlifters usually max out those lifts from heaviest to lightest in that order. In this Catalyst Athletics article, Greg Everett notes that the front squat and overhead squat are roughly 85–93% and 65–70% of the back squat, respectively. In another article, he also points out that front-to-back ratios can vary across a training cycle.
For the average CrossFitter, the gaps can be larger—often due to mobility limitations, especially overhead. I had a friend at a previous gym who could back squat well over 300 lb but struggled to overhead squat 100 lb. That’s an extreme case, but it makes the point: the overhead squat is frequently limited by positions and mobility, not just leg strength.
We can also change the “difficulty” of a squat without changing the movement: pauses, tempo (slow descent/fast ascent), starting from the bottom, and higher-rep sets all tend to make a given weight feel heavier.
To use all of these squat sets in one model, I need them on a common scale. For each set, I compute a “back-squat-equivalent 1RM” using: - the conservative end of the front/back and overhead/back ratios above - small modifiers for pause/tempo work (which I do infrequently) - the Epley formula to convert (N)-rep sets to an estimated 1RM equivalent
These equivalencies are population-based and could be personalized, but my data are relatively sparse—so keeping them fixed reduces degrees of freedom and helps keep the model stable.
Kalman filters
I used Kalman filters because they’re built for estimating an underlying signal from noisy, irregular observations. Conceptually, I treat “strength” as a hidden state that evolves over time, and each logged squat set as a noisy measurement of that state. The noise comes from things like imperfect equivalency ratios between lifts, differences in effort (some days are “send it,” some are technique), and normal day-to-day performance variation.
A Kalman filter alternates between (1) predicting today’s state from the previous estimate and (2) correcting that prediction using the new observation—while also tracking uncertainty through time. Once the model estimates both current strength and its rate of change, it can also project forward (with uncertainty expanding as you move farther from the last observation).
I built this model with the Python library PyKalman.
Step 3: Predictions
Once you have models for body weight and squat strength, the prediction step is straightforward: forecast both on the same future dates, then find the first date when predicted back squat exceeds predicted body weight. I project up to six months ahead. That’s somewhat arbitrary, but it feels reasonable given how often I test a true 1RM back squat—I’d expect at least 1–2 tests in that window.
Step 4: Visualizations
Plots are my favorite form of model validation. Does the fit look right? It’s a good gut check. Plus, creating great figures was one of the highlights of my (brief) time in astrophysics research—beautiful data deserve beautiful figures.
I have extensive experience making static figures with Matplotlib and Seaborn, but I wanted to challenge myself and build interactive visuals using a new-to-me library: Plotly.
The code for the modeling and figure generation lives here. Throughout the project, I relied heavily on Pandas for the data analysis.
Step 5: Automation
Here’s where the fun begins (at least for me). I wanted my only ongoing work to be the real work: eating well, stepping on the scale, getting to the gym, lifting, and logging results in BTWB. Everything else should be automatic: ingest new data, refit the models, and update the live dashboard.
I chose Google Cloud Platform not just for this project, but for the website as a whole. I’ve used both GCP and AWS in my career, and either would have worked. But as of writing this, I’m between jobs—so cost mattered most. Google’s free credits made it an easy choice. I also prefer BigQuery to Athena for the kind of SQL-style work I’ve done most often.
The first step was containerizing everything with Docker. Containers let you package code that runs on your laptop into a standalone application that can run consistently on another machine. In practice, you define a base image, install dependencies, set environment variables, include any supporting files, and run the app from a single CLI entry point. Sensitive values are typically passed via environment variables; in my case, that includes my BTWB credentials and Withings OAuth secrets/tokens. I manage those via Google Secret Manager.
This project uses three containers: (1) fetch body weight measurements from the Withings API, (2) scrape BTWB for completed workouts, and (3) combine the data, fit the models, generate forecasts, and build the visualizations. I kept them separate in case so I could reuse the data later. For example, I’m just added a “What’s Traci Doing?” feature that shows my recent training in a simple calendar view (a nod to “What’s Rich Doing?” and Rich Froning).
I store the raw data in Google Cloud Storage as JSON, partitioned by year and month. On a daily schedule, Google Compute Engine runs the two data-ingestion containers, fetching only the last 7 days and upserting into the existing dataset. Then the third container regenerates the dashboard and writes the updated outputs to a public bucket served under a subdomain of this site.
Summary
So now, we wait. As I’m writing this, the tracker predicts I’ll be ringing the PR bell around the Fourth of July. I don’t plan to change my training volume or programming, and I’m happy to be patient for a few more months; but if this drags past a year, you might see me run a dedicated squat cycle. The nice part is that I’m pulling two levers at once: getting stronger and getting lighter. That should get me there sooner than chasing a fixed number on the bar.
The main goal of this project was to level up my cloud computing skills, build interactive dashboards, and experiment with AI coding assistants. There are plenty of ways I could improve the model’s accuracy, but I’m not motivated to do that right now. The tracker updates daily and will keep retraining on new data. And there’s also a psychological factor no model can capture: if the dashboard says I’m not progressing fast enough, that can motivate me to change my behavior—and it already is. The data show my weight loss has leveled off lately, so my nutritionist and I are working on a new strategy to get back on track. And I’ll be ecstatic if I beat the prediction.